Stanford AI Index 2026 shows the paradox of 53% adoption and 40-point transparency
Stanford HAI published the AI Index 2026 report: generative AI reached 53% global adoption in three years while model transparency fell from 58 to 40.

- What happened: Stanford HAI published the AI Index 2026 report on April 13, 2026.
- The report says generative AI reached 53% global adoption within three years, faster than PCs, the internet, or smartphones at the same point.
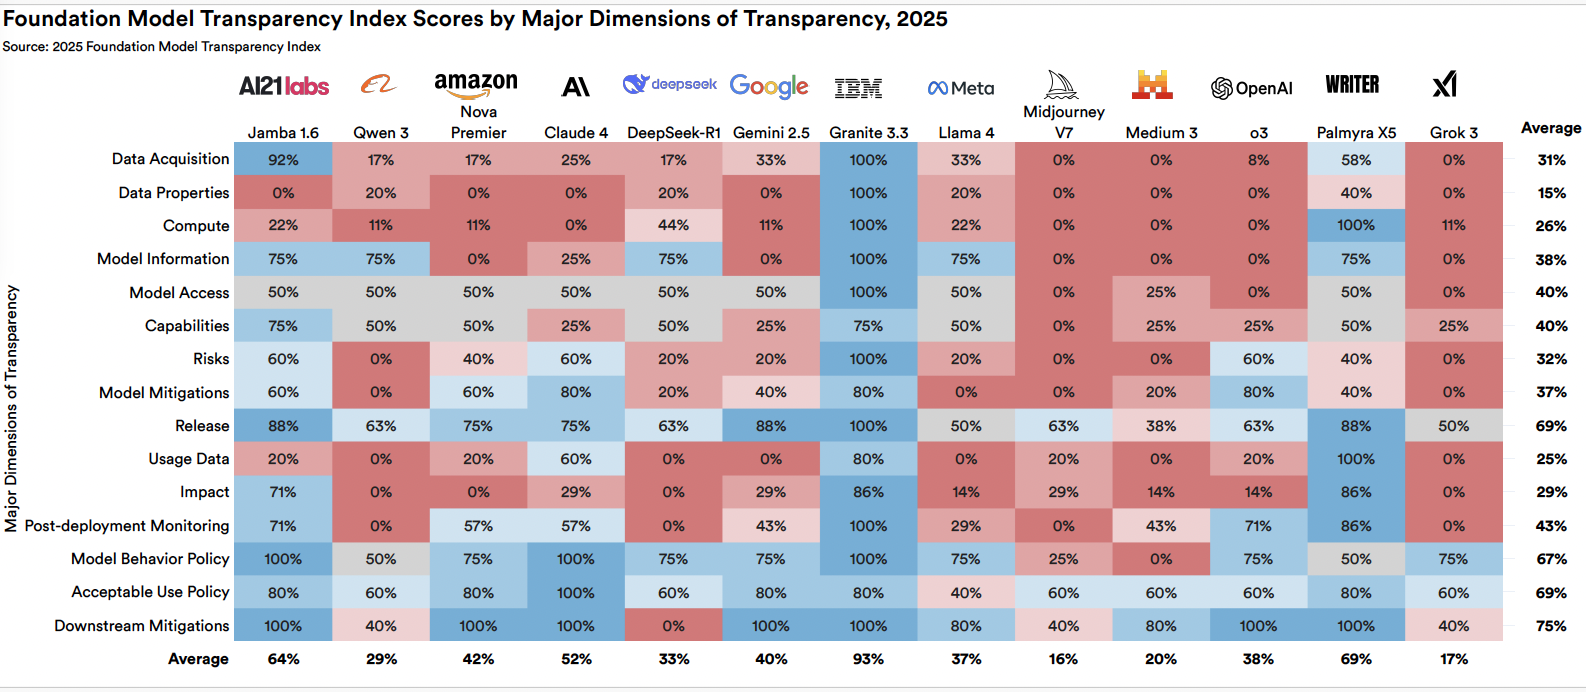
- The paradox: while adoption rose, the Foundation Model Transparency Index average fell from 58 to 40.
- Stanford's warning is direct: the systems used by more people are becoming harder for outsiders to inspect, audit, and govern.
- Agent signal: Terminal-Bench task success jumped from 20% in 2025 to 77.3% in 2026.
- Watch: investment, electricity demand, fragmented regulation, and education policy are now part of the AI performance story.
Stanford HAI, the Human-Centered Artificial Intelligence institute, published its AI Index 2026 report on April 13, 2026. Since 2018, the report has functioned as one of the AI industry's annual scorecards, used by policy teams, investors, researchers, and product leaders. This year's numbers converge on a contradiction: generative AI has reached 53% of the global population within three years, but model transparency is falling quickly. The Foundation Model Transparency Index average dropped from 58 to 40, a 31% year-over-year decline.
The report's diagnosis is blunt: AI capabilities are advancing faster than the ability to measure and govern them. That sentence captures the central tension for builders. AI is no longer a lab technology waiting for adoption. It is already inside classrooms, coding tools, consumer products, enterprise workflows, and public policy debates. The unresolved question is whether the industry can explain, audit, and constrain systems that have become widely used before governance caught up.
What changed in this year's AI Index
AI Index is not a simple trend deck. It is a large data project assembled by an interdisciplinary group spanning academia and industry. The 2026 edition adds three themes that were less central in earlier reports: practical AI-agent performance, data-center energy demand, and a quantified decline in model transparency.
That shift matters. Until 2025, the dominant question around AI Index was usually "how fast is AI improving?" In the 2026 report, the sharper question is "can institutions evaluate and control a technology that is improving this fast?" Stanford researchers frame the moment as a move from AI evangelism to evaluation. For product teams, that means the benchmark chart is no longer enough. Deployment evidence, transparency, electricity, regulation, and failure rates now belong in the same conversation as model quality.
A technology that spread faster than PCs
The most striking adoption number is the 53% global population figure. PCs, the internet, and smartphones did not reach that level within three years of mainstream availability. Stanford also estimates the annual value of generative AI tools to U.S. consumers at $172 billion, with median user value tripling from 2025.
The adoption map is uneven. The United States, despite being the largest AI exporter and investor, ranks only 24th in adoption at 28.3%. Singapore leads at 61%, followed by the UAE at 54%. The report connects adoption strongly with GDP, and it also shows that the country producing AI systems is not necessarily the country using them most intensively. That pattern echoes a16z's recent Top 100 AI apps report, where the United States ranked 20th in per-capita AI adoption.
Population adoption three years after launch
Based on Stanford AI Index 2026 estimates
2022-2025
2007-2010
1993-1996
1981-1984
Transparency fell as models became more consequential
The transparency decline is the report's most contested signal. The Foundation Model Transparency Index average fell from 58 to 40. Stanford says the most capable recent models are also the least transparent. Large AI companies are disclosing less about training code, dataset size, parameter counts, and other details that external auditors need to evaluate risk.
This is not just a disclosure preference. If the most used and most capable models become harder to inspect, outside researchers, customers, regulators, and downstream developers lose visibility into the systems they depend on. The adoption number and the transparency number therefore belong together: a technology used by roughly half the world is becoming more opaque at the model layer.
The report's competitive context explains part of the pressure. The U.S.-China performance gap on benchmarks such as MMLU and HumanEval has narrowed from single digits to nearly zero. As of March 2026, Stanford's research note says Anthropic's top model led by only 2.7%. When benchmark advantage compresses, training data, architecture details, and internal evaluation methods become more valuable trade secrets. That reduces the incentive to disclose exactly the information governance teams need.
Agents moved from slogan to measurable work
The most dramatic capability change appears in AI-agent task performance. On Terminal-Bench, real task success rose from 20% in 2025 to 77.3% in 2026. In cybersecurity tasks, success rose from 15% in 2024 to 93% in 2026.
Those numbers do not mean every enterprise workflow is ready for autonomous deployment. They do show why agent tools have moved from demo rhetoric into production planning. In 2025, "the year of agents" was mostly a product slogan. A 20% success rate justified skepticism. A 77.3% result on a practical benchmark changes the planning discussion for developer tools, IT automation, incident response, and constrained operations work.
AI-agent practical task success
Terminal-Bench tasks
Cybersecurity problem solving
Source: Stanford AI Index 2026. Terminal-Bench baseline.
The boundary still matters. Terminal-Bench is a specific benchmark, not a guarantee that agents work across every domain. Stanford also acknowledges areas where AI has not yet produced measurable productivity gains. The stronger conclusion is narrower and more useful: agents are now good enough in some constrained settings that teams should evaluate harness design, permissions, observability, and rollback mechanisms instead of treating agents as a speculative category.
Investment exploded without preserving a clear U.S. lead
The money line is large even by AI standards. Global corporate AI investment reached $581.7 billion, up 130% year over year. Private AI investment reached $344.7 billion, up 127.5%. The U.S.-China investment gap is even sharper: $285.9 billion in the United States versus $12.4 billion in China, a 23.1x difference.
The report's uncomfortable detail is that spending advantage does not translate cleanly into benchmark dominance. The United States can outspend China by more than 20x while the top-model performance gap narrows to 2.7%. That does not prove that U.S. investment is wasteful or that Chinese labs are structurally more efficient. It does show that AI leadership is no longer explainable by capital alone. Model quality, talent, open-source diffusion, compute access, regulation, and distribution all interact.
Electricity became part of the model story
The physical infrastructure numbers are no longer background context. AI data-center power capacity reached 29.6GW, roughly the peak demand of New York State. U.S. data centers consume about 176TWh annually, around 4.4% of national electricity use. Another 550 data-center projects, totaling 125GW, are in the pipeline. Around 60% of current data-center energy comes from fossil fuels, and electricity prices are up 42% from 2019.
For builders, this changes the meaning of model efficiency. A model that is cheaper per token, easier to quantize, or less dependent on high-end GPU clusters is not only a cost optimization. It can become a deployment enabler when power availability delays projects. If half of data-center projects are already delayed by power constraints, energy planning becomes part of AI product planning.
Regulation is spreading faster than enforcement capacity
The regulatory map is expanding, but unevenly. 47 countries have introduced AI-related legislation, and 23 have enacted laws. Only 12 countries have enforcement systems in place. Global AI enforcement actions rose to 156 in 2025, compared with 43 in 2024. The EU accounts for 89 actions, followed by North America with 31 and Asia-Pacific with 24.
Compliance costs also vary sharply. Stanford's research note cites a gap between Singapore at $180,000 and the EU at $1.4 million, an 8x spread. Only eight countries have mutual-recognition agreements, so global AI services face fragmented obligations. Surveyed organizations named regulatory uncertainty as the biggest obstacle to AI deployment at 68%.
For product teams, the lesson is operational. A model shipped globally may need region-specific documentation, risk classification, human oversight, incident handling, logging, and procurement evidence. The EU AI Act's August 2026 enforcement timeline turns transparency from a public-relations issue into a release-management issue for teams serving regulated markets.
Education is already using AI without enough policy
The education numbers are among the report's most direct governance gaps. In the United States, 80% of high school and college students use AI for schoolwork. Only about half of middle and high schools have an AI policy, and only 6% of teachers say the policy is clear.
That gap is not a future problem. Students are already using AI in routine work, while institutions are still debating what counts as acceptable assistance, plagiarism, source use, and assessment integrity. For developers building education tools, the policy layer is not optional. Product design has to account for disclosure, teacher controls, citation, audit trails, and age-appropriate guardrails.
What this means for AI builders
The report gives developers and AI operators three practical signals.
First, agent development is no longer just an experiment. A move from 20% to 77.3% success on Terminal-Bench means agentic workflows deserve real evaluation in production-adjacent environments. The work now shifts from "can an agent do anything useful?" to "which tasks should an agent own, what permissions does it need, and how do we detect failure quickly?"
Second, falling transparency increases the value of open models, independent benchmarks, and internal evaluation. If commercial frontier systems expose fewer details, teams choosing models must look beyond headline quality. They need provenance, auditability, disclosure, data-handling commitments, and reproducible tests on their own workloads.
Third, regulatory fragmentation needs to be treated as an architecture constraint. With 47 countries moving on AI law and limited mutual recognition, global AI products will not be governed by one uniform rulebook. Teams should separate model routing, logging, retention, human review, and region-specific policy so compliance changes do not require a full product rewrite.
| Metric | 2025 | 2026 | Change |
|---|---|---|---|
| Generative AI adoption | - | 53% | Reached in three years |
| Transparency index average | 58 | 40 | Down 31% |
| Agent success on Terminal-Bench | 20% | 77.3% | Up 287% |
| Cybersecurity-agent success | 15% | 93% | Up 520% |
| Global corporate AI investment | $252.7B | $581.7B | Up 130% |
| Private AI investment | $151.6B | $344.7B | Up 127.5% |
| Global AI enforcement actions | 43 | 156 | Up 3.6x |
| Public optimism about AI benefits | 52% | 59% | Up 7pp |
Source: Stanford AI Index 2026
Public reaction: optimism and anxiety rose together
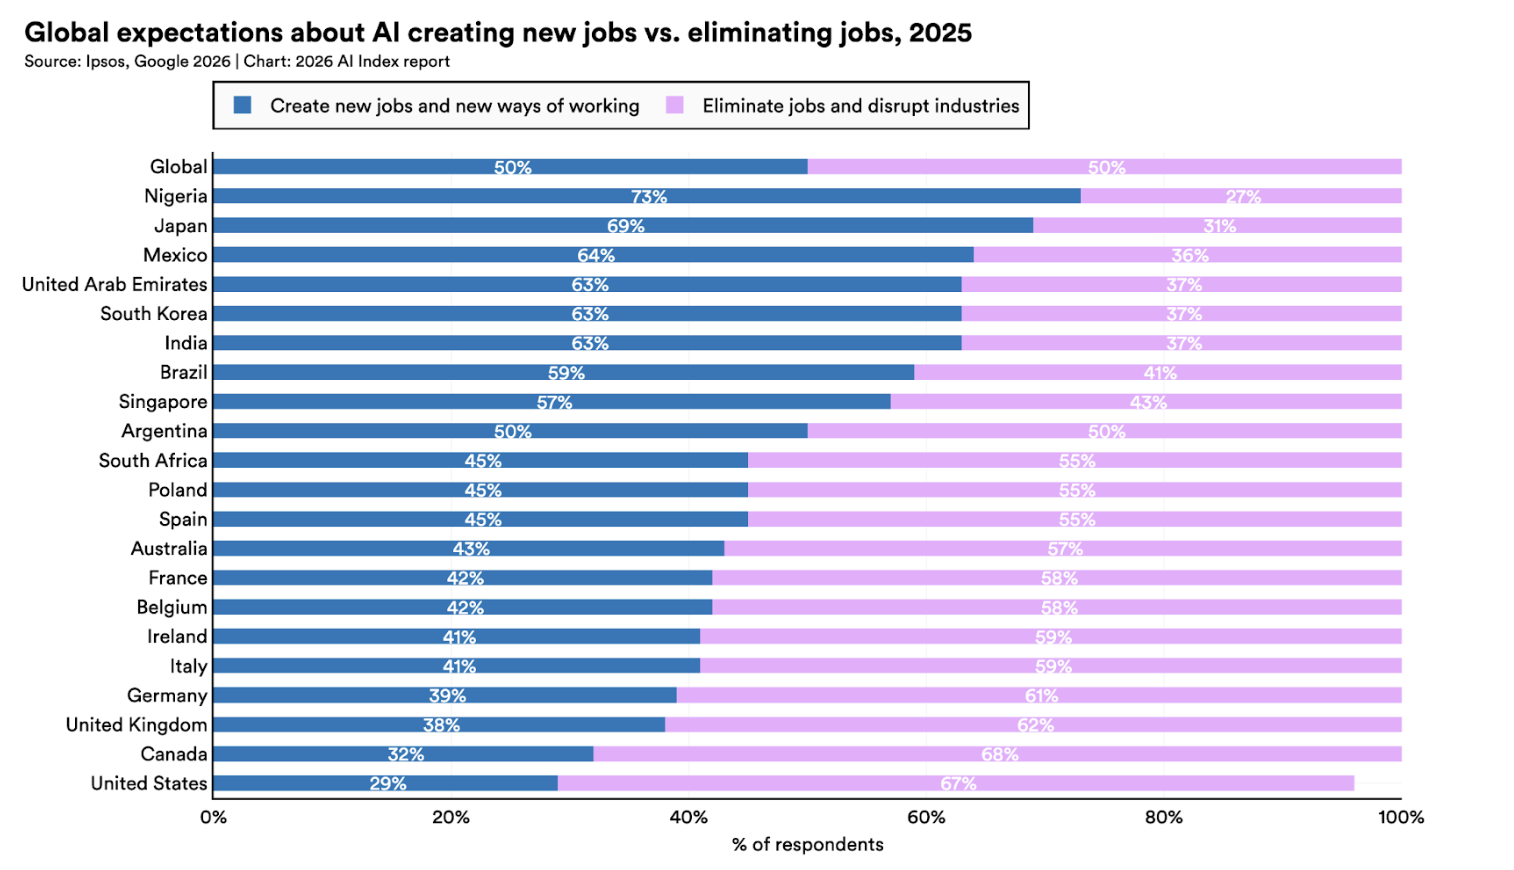
Stanford's public-opinion data is also mixed. 59% of respondents are optimistic about AI's benefits, up from 52% the prior year. At the same time, 52% express anxiety about AI. In the United States, only 33% expect AI to improve their jobs, compared with a global average of 40%, and 35% expect broad instability and problems over the next decade.
The most revealing trust figure may be government regulation. U.S. confidence in AI regulation is the lowest among surveyed countries at 31%. The country that builds and funds much of the AI industry has unusually low public confidence that its own government can regulate it well.
The next test is evaluation, not evangelism
Stanford AI Index 2026 describes a complicated industry: AI is spreading faster than any earlier consumer technology, while the internal details of leading models are becoming harder to see. Agents are entering practical territory, while schools are still behind basic usage policy. Investment is exploding, while capital does not guarantee benchmark advantage. Regulation is expanding, while enforcement capacity remains thin.
The next signals to watch are concrete. Does the agent-performance curve continue in 2027, or does it saturate? Does EU AI Act enforcement force better transparency, or does disclosure continue to decline? Do power constraints slow data-center expansion? Does the U.S.-China benchmark gap stay near zero, pushing competition toward ecosystem, talent, and regulation? Do the failed AI projects Stanford researchers warn about become visible enough to reset market expectations?
The report's "evaluation era" framing is useful because it moves the conversation away from abstract optimism or pessimism. The numbers ask for stricter measurement, clearer disclosure, and evidence of utility before speculative promises. A 53% adoption rate and a 40-point transparency score say the same thing from different directions: AI has been accepted faster than institutions were prepared to evaluate it.