Honeycomb Agent Timeline rewinds agent failures
Honeycomb Agent Timeline turns LLM calls, tool use, handoffs, retries, and downstream system spans into a production timeline for AI agents.
- What happened: Honeycomb announced
Agent Timeline, Canvas Agent, and Canvas Skills.- Agent Timeline is in early access and reconstructs LLM calls, tool use, handoffs, retries, and system spans in chronological order.
- Why it matters: The agent market is moving from "can it act" to "can we explain what it did after it acted."
- Developer impact: Production agents now need
OpenTelemetry-based traces for retries, cost, downstream failures, and permission boundaries.- Prompt logs alone cannot explain a multi-agent handoff, a bad tool input, or a hidden retry loop.
- Watch: The product is tied to Honeycomb customers and early access availability, while AI observability standards are still evolving.
Honeycomb announced Agent Observability on May 12, 2026, with three named pieces: Agent Timeline, Canvas Agent, and Canvas Skills. On the surface, this looks like a normal observability product release. The more important signal is broader. As AI agents start acting in production, engineering teams need to answer a different question. The question is no longer only "what did the model say?" It is "what did the agent do, why did it choose that path, and which systems did it touch?"
Honeycomb is framing that problem as a timeline problem. A production agent run can include a planner agent, retrieval agent, coding agent, approval agent, external API, database query, queue, browser session, and shell command. Retries can happen in the middle. One agent's summary can become the next agent's prompt. Model latency can interact with a downstream API outage. That investigation does not look like finding one HTTP 500 in a traditional APM dashboard.
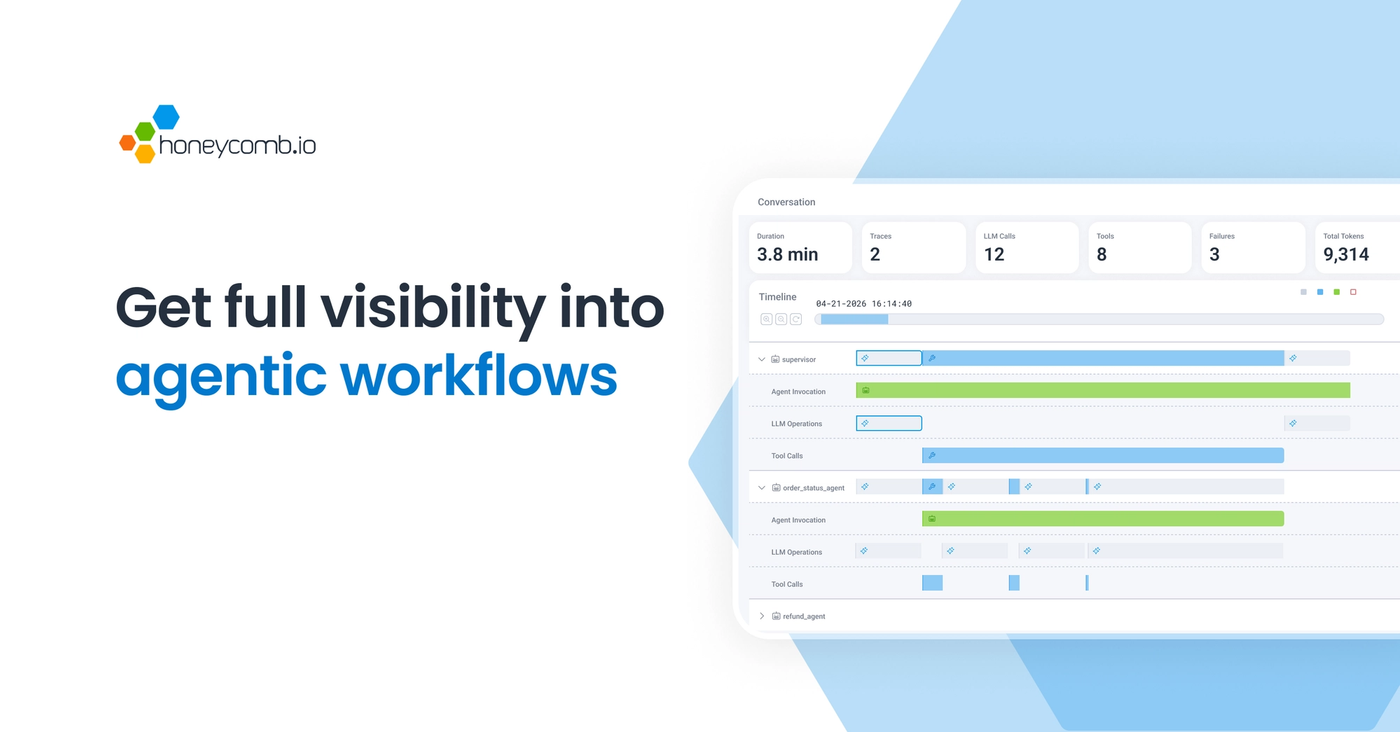
Agent Timeline is designed for that messier shape. Honeycomb says the product lets a user open one agent conversation, see total duration, model calls, tool calls, retries, participating agents, and failures, then drill down into spans for LLM operations, tool calls, token usage, prompt details, API calls, database queries, and infrastructure behavior. The pitch is not simply "LLM tracing." It is a single investigation flow that connects agent behavior with the full-stack trace around it.
Agent failures look like conversations
Traditional observability grew around requests, services, metrics, logs, and traces. A user clicks a button, a request reaches a backend service, the service calls a database, and an operator follows the trace ID to find which service was slow or which query failed. Microservices made this complicated, but the basic incident shape remained stable.
AI agents add semantic state inside the request. The agent interprets the user's request, builds a plan, chooses tools, evaluates intermediate results, hands work to another agent, and tries again when something fails. In that world, "POST /tools/search took 1.2 seconds" is not enough. The operator also needs to know why the agent chose search, how it interpreted the result, what triggered a retry, which handoff lost context, and how a small downstream degradation changed the final decision.
That kind of event is closer to a conversation than a line in a log. User message, agent step, model call, tool input, tool output, retry, handoff, and system span all influence one another. Honeycomb's choice of the word "timeline" is therefore not cosmetic. Agent debugging is less like unfolding one waterfall and more like replaying several actors on the same clock.
The three pieces Honeycomb announced
The first piece is Agent Timeline. Honeycomb describes it as a coherent view of multi-agent, multi-trace workflows. The interface starts with a conversation-first investigation path. A user opens an agent conversation ID, reviews summary data such as duration, model calls, tool calls, retries, agents, and failures, then moves into failed spans or downstream system root cause. The message is clear: "what the agent did" and "how the system responded" should not live in separate tools.
The second piece is Canvas Agent. Canvas is Honeycomb's collaborative investigation space and chat interface, and Honeycomb is pushing it toward autonomous investigation. The announcement says Canvas Agent can gather data, form hypotheses, test them, and suggest remediation when an alert fires, an SLO burns, or an anomaly appears. This is "observability for AI" and "observability with AI" in the same release.
The third piece is Canvas Skills. Honeycomb presents Skills as reusable playbooks that encode debugging knowledge, framework conventions, and service best practices. For a system such as Kafka, for example, a skill can guide which questions to ask, which spans and metrics to inspect together, and which hypotheses to test first. In practice, this is an attempt to move expert operational knowledge into repeatable agent behavior.
Availability matters here. Canvas, Canvas Agent, and Skills were announced for Honeycomb customers, while Agent Timeline is in early access with general availability expected the following month. This is not yet a tool every development team can adopt immediately. But the market signal is still useful. Agent operations are no longer being sold only as more automation. They are being sold as the ability to interpret the behavioral record left by automation.
| Observation target | Traditional APM view | Agent Timeline target |
|---|---|---|
| Unit | Request, service, endpoint, trace | Conversation, agent, handoff, tool run |
| Failure cause | Latency, error rate, dependency failure | Bad tool choice, retry loop, context loss, downstream degradation |
| Investigation path | Dashboard, log search, trace waterfall | Chronological agent replay with full-stack span drilldown |
Why OpenTelemetry keeps appearing
The repeated technical term in Honeycomb's announcement is OpenTelemetry. Honeycomb says the new agent observability features align with OpenTelemetry GenAI standards so teams can generate structured GenAI insight without proprietary SDK or framework lock-in. That matters beyond the marketing line. If agent observability is trapped inside each vendor SDK, teams will have to rebuild telemetry whenever they change agent frameworks. Worse, multi-agent and tool-heavy systems will lose a shared language.
OpenTelemetry already has a central position in distributed tracing. The same pattern is now emerging around AI agents. Model providers, agent frameworks, vector databases, MCP servers, tool runtimes, browser automation layers, and workflow engines all need to emit telemetry. If span names, attributes, and event semantics diverge, the timeline breaks quickly. An event called "LLM call" might mean prompt completion in one system and include tool execution in another.
Honeycomb has been preparing this argument. In an April 2026 post on OpenTelemetry and AI feedback loops, the company described GenAI semantic conventions as a way to define trace spans and event naming patterns for agents, LLMs, MCP, and tools. Agent Timeline is a product expression of that direction. AI observability is moving from prompt-and-response storage into standardized distributed-system telemetry.
Still, standards do not automatically create interoperability. GenAI semantic conventions are still evolving, and every framework implements them with different depth. Cost, token usage, prompt redaction, tool input retention, and privacy deletion policies also vary by product. Teams should treat "OpenTelemetry support" as the start of evaluation, not the end. The concrete question is whether handoffs, tool results, retries, cost, and safety events are recorded in attributes that can support incident investigation.
Why this is happening now
Enterprise AI announcements in 2026 share a pattern. There are still many releases about smarter models, but just as many are about controlling, deploying, and monitoring agents. Red Hat has emphasized developer tools and local sandboxes. UiPath has pushed coding-agent orchestration and governance. Veeam has framed data and recovery as a trust layer for agents. Honeycomb is taking the observability position in the same shift.
The shift is natural. Demo agents only need to show a successful screen. Production agents need to explain failure. A team may have to prove whether an agent changed a customer account, read the wrong document, called a payment tool, created a cloud resource, or put sensitive data into a prompt. "The model decided that" is not an operational answer.
Governance and observability are especially hard to separate in agentic workflows. Without observability, a team cannot find policy violations. To enforce policy, the system must know what action occurred in real time or after the fact. An agent repeatedly calling an expensive model, trying to run a destructive command without approval, or retrieving an outdated policy document may not show up as a simple error-rate spike. What is needed is a behavioral trace and tools that can interpret it.
The skepticism is part of the story
Honeycomb's direction is interesting, but its claims still deserve scrutiny. The company has previously argued strongly that AI changes observability, and the community response has been mixed. GeekNews summarized Honeycomb's argument that LLMs can level up analysis while OpenTelemetry levels up instrumentation. The point about faster feedback loops and human-AI collaboration is credible.
Hacker News discussion around related Honeycomb posts has been more cautious. Some users say Honeycomb is genuinely useful in practice, while others argue that messaging like "AI can look at graphs and solve the problem" is too broad. Collecting, storing, querying, and interpreting telemetry is still difficult. AI can generate hypotheses quickly, but humans still often need to verify them.
That criticism applies to Agent Timeline too. A timeline can make reconstruction easier, but it does not automatically remove responsibility for root-cause analysis or remediation. The timeline has to be instrumented well, sensitive data has to be handled carefully, and operators still need to decide which hypothesis is actually true.
Reddit discussions about agent observability tend to point in the same direction. Developers often argue that agent observability is still stuck at LLM tracing. Prompt and response capture misses many real failure modes. State transitions, memory lineage, handoff payloads, tool errors, cost anomalies, retry loops, and approval boundaries all need to be visible. Honeycomb's announcement matters because it puts that broader framing at the center of the product story. Its early-access status also means the real depth of the implementation still needs field validation.
From LLMOps to AgentOps
A few years ago, the base unit of LLMOps tooling was the prompt, completion, evaluation, dataset, and model version. LangSmith, Langfuse, Arize Phoenix, Humanloop, Weights & Biases, and similar tools built useful workflows around prompt tracing and evaluations. Those workflows still matter. But as agentic applications become common, the unit is shifting. Multi-step runs, graph execution, tool results, external side effects, and human approval are now central.
Honeycomb enters that market from a different starting point than specialist LLMOps tools. Its strengths are high-cardinality telemetry, distributed tracing, and production debugging. Its open question is whether it can match the depth of tools that were built around prompts, evals, and framework-specific agent traces. Meanwhile, Datadog, Grafana, New Relic, and open-source stacks are also moving toward AI and LLM observability.
The likely outcome is not a single product owning the whole category. The market may become layered. Application developers can emit run traces from LangGraph, OpenAI Agents SDK, Vercel AI SDK, CrewAI, AutoGen, or internal frameworks. Observability backends can receive those traces through OpenTelemetry. LLMOps layers can manage prompt versions and evaluations. Governance layers can track policy violations and approvals. Honeycomb's Agent Timeline is clearly positioned around production debugging and system-impact reconstruction.
What teams should check now
This news is too narrow if it is read only as a Honeycomb buying question. The broader question is whether the AI agents a team is building today leave explainable evidence behind. Console logs and transcripts can look sufficient during a demo. They are not enough for production. Tool-call inputs and outputs, model names, token usage, cost, latency, retry count, external requests, human approvals, policy decisions, and redaction events all need a traceable home.
First, connect the agent run ID to the distributed trace ID. If a user's task creates a run inside an agent framework and a separate trace across backend systems, an incident investigator will eventually have to stitch two screens together by hand. The direction shown by Agent Timeline is conversation-level navigation down into system spans. Even teams building their own stack should design that link early.
Second, record tool calls as spans rather than loose logs. The span should include the tool name, input schema, output size, error type, retry information, and permission boundary. If the agent can modify real systems, read-only tools and write tools must be separated. Approval state should also be part of telemetry. After an incident, "which tool ran" and "who approved it" are among the first audit questions.
Third, define prompt and output retention policy. Storing every prompt may improve debugging, but it can also store personal data, trade secrets, customer records, and internal documents. Storing nothing makes debugging impossible. Redaction, sampling, retention, and access control should be designed together with telemetry. Agent observability is not just a technical feature. It is also a security policy.
Fourth, do not trust averages. Agent workflow failures can hide inside normal-looking average latency or average token cost. One agent may enter a retry loop only for a specific customer segment. A tool may return stale data only for one region. A handoff may drop a field only when the conversation takes a rare branch. High-cardinality queries and outlier investigation are not luxury features in this setting. They are part of the operating model.
Observing AI and observing with AI need each other
The most interesting part of Honeycomb's release is that it pushes in two directions at once. Agent Timeline observes AI. Canvas Agent and Skills observe with AI. The first direction reveals agent behavior. The second asks an agent to help investigate production incidents. These two directions depend on each other. An observability agent needs strong traces to form useful hypotheses, and the agent's own investigation should also leave a trace and timeline.
This structure will likely appear in many operational tools. In security, an AI agent may triage alerts, but the agent's decision process needs an audit trail. In data platforms, an AI agent may analyze pipeline failures, but teams need to know which queries and samples it inspected. In coding systems, an agent may create a bug-fix pull request, but reviewers need to see which logs and test failures motivated the patch. As soon as AI helps operate the system, AI itself becomes part of the system to operate.
The balance is between automation and accountability. Automatic investigation and remediation are attractive. But as automation expands in production, explanation, rollback, and approval become more important. Honeycomb's announcement captures that tension well. The faster an agent moves, the more operators need a timeline they can rewind.
The unanswered questions
The first question is implementation depth. The product page says Agent Timeline can show conversations, agent lanes, spans, failure filters, and downstream root cause. The practical issue is whether telemetry from different frameworks, model providers, MCP servers, and workflow engines can be captured consistently. "Aligned with OpenTelemetry" and "ready-to-use integration" are not the same thing.
The second question is cost. Agent workflows can generate large amounts of telemetry. Storing every model call, tool call, prompt detail, token metric, downstream span, and failure event grows quickly. Honeycomb's strength is high-cardinality telemetry, but customers still have to make choices about retention, sampling, redaction, and storage cost. Better observability increases both operational visibility and the surface area of sensitive data.
The third question is competitive response. Datadog, Grafana, New Relic, LangSmith, Langfuse, Arize, and other vendors can all interpret "agent observability" from different positions. Some are strong in production traces. Some are strong in evaluation and prompt versioning. Some are attractive because they can be self-hosted. Honeycomb is trying to win the production-debugging language of this market, but buyers will likely assemble layers according to their own agent maturity and risk profile.
The black box is operational debt
Honeycomb Agent Timeline matters because it treats agent observability as a production layer, not a nice-to-have feature. If AI agents read, write, modify, deploy, and talk to customers, their behavior needs to be replayable. A transcript is not enough. A prompt log is not enough. Agent handoffs, tool calls, retries, cost, and downstream system spans need to share one timeline.
This is not only a Honeycomb story. The whole agent market is moving this way. Models are acting faster, frameworks are attaching more tools, and companies are delegating more work. The question that follows is unavoidable. After "can the agent do it?" comes "can we explain what the agent did?" Honeycomb's answer is a timeline. Other vendors will offer different answers. But for production AI teams, a black-box agent is no longer an impressive demo. It is operational debt.