Honeycomb Agent Timeline turns agent failures into postmortem evidence
Honeycomb Agent Observability signals a shift from logging model calls to reconstructing agent workflows as production timelines.
- What happened: Honeycomb announced Agent Observability features around
Agent Timeline, Canvas Agent, Skills, MCP, and AWS Bedrock AgentCore integration.- The official announcement was published on May 12, 2026, with OpenTelemetry-based instrumentation positioned as the connective tissue for production agent workflows.
- Why it matters: Agent operations are moving from "did the model answer well?" to "can we reconstruct the failure path with evidence?"
- Watch: Tool calls, model calls, retrieval, cost, retries, approvals, and policy gates now need to sit inside one observable timeline.
- OpenTelemetry's GenAI semantic conventions are still marked Development, so teams should treat the instrumentation contract as important but not fully settled.
Honeycomb's Agent Observability announcement on May 12, 2026 looks, at first glance, like a product update from an observability company. The more interesting part is the problem framing. Honeycomb is not treating AI agents as a bundle of LLM calls. It is treating them as operational workflows: model calls, tool calls, retrieval, external APIs, human approval, retries, and recovery steps that unfold over time. That is why the central interface is not just a dashboard or report. It is called Agent Timeline.
That distinction matters. When a chatbot gives a bad answer, a team can often inspect the prompt and response and make a reasonable guess about what happened. Once an agent starts touching real systems, the problem changes. A support agent may update a ticket. An operations agent may inspect cloud resources. A coding agent may trigger a pipeline. An incident-response agent may call several observability tools before writing a conclusion. In those workflows, "the final answer was wrong" is less useful than "which step led the system down the wrong path?" The missing artifact is not another model leaderboard. It is a black box for agent execution.
Honeycomb's launch lands directly on that need. The company introduced Agent Timeline, Canvas Agent, Skills, MCP, and AWS Bedrock AgentCore integration together. Its Agent Timeline product page describes visibility into agent workflows and operations. The Honeycomb MCP documentation says AI agents can query traces, triggers, SLOs, single traces, and raw data rows, and can use observability data to investigate performance anomalies or instrumentation gaps through natural language. Put together, the message is clear: if AI agents are entering production operations, the agents themselves become production systems that need to be observed.
Why agent observability needs its own layer
Traditional observability is already powerful. Teams can trace which service slowed down, which deployment raised the error rate, whether latency spiked for a particular customer segment, and which span sits on the critical path. AI agents add another decision layer on top of that system behavior. The same HTTP 500 means different things depending on whether the bug came from human-written code, a bad tool selection, stale context, a missing retrieval result, a permission failure, or an agent fallback path.
Early LLM applications could often get by with prompt logs, response logs, and token counts. Agents create more complicated failure modes. Imagine an incident-investigation agent concluding that a recent deployment caused an outage. To trust that conclusion, the team needs to answer a long chain of questions. Which time window did the agent query? Which service traces did it inspect? What query did it generate? Which raw rows did it cite? How many model calls happened? Which model call chose a tool? Were there retries? Did a policy gate or human approval step intervene? If the conclusion was wrong, where did the mistake begin?
Token aggregation and LLM cost monitoring alone cannot answer those questions. Traditional distributed traces are also incomplete by themselves. A trace can show service execution, but agent-specific units such as reasoning steps, tool choice, prompt context, model response, and conversation state do not fit cleanly into ordinary service-call mental models. Agent observability therefore sits between LLMOps and APM. Honeycomb's timeline framing makes sense because agent execution is ultimately an ordered production event.
The four pieces Honeycomb is tying together
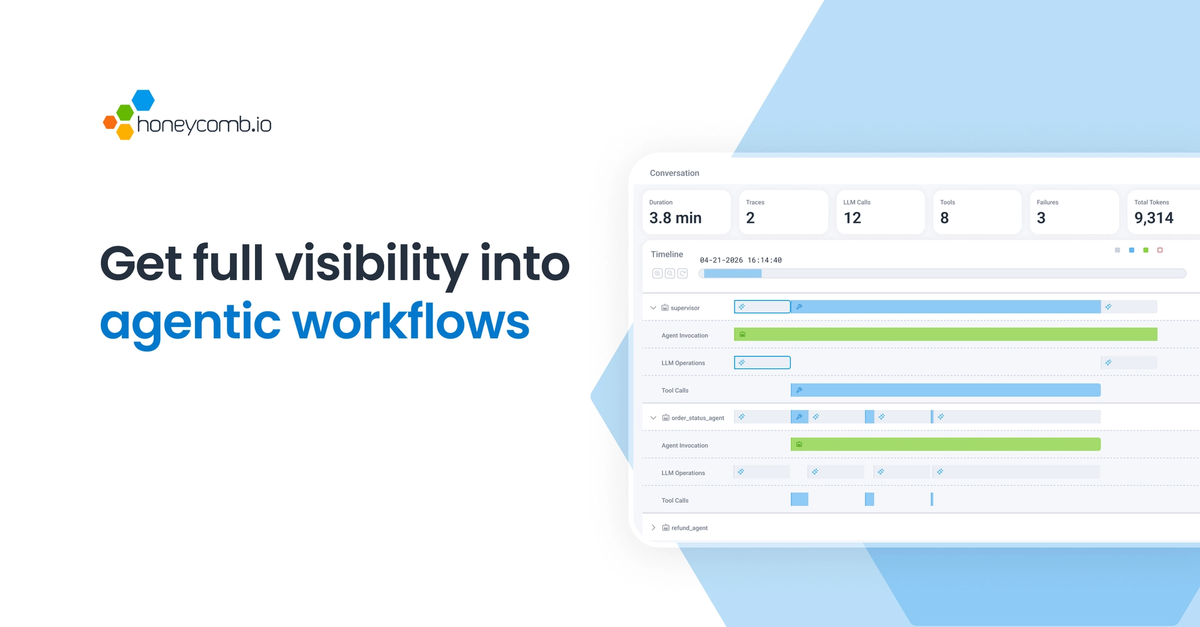
The first piece is Agent Timeline. The important shift is from "which model did we use?" to "what did the agent do, in what order, with which evidence?" A useful postmortem needs model calls, tool calls, errors, latency, cost, and external system calls connected inside a single task rather than scattered across separate logs.
The second piece is Canvas Agent. Honeycomb is also connecting the human act of exploring observability data with an agent inside the observability product. The key issue is not simply that an agent might draw a dashboard faster. It is that an agent with access to operational data needs permission boundaries and evidence trails. Observability data is rich, but that richness also raises the stakes. A bad query, an over-broad permission, or a confident but unsupported investigation summary can make incident response worse.
The third piece is Skills. Across coding agents and business agents, reusable procedures are being packaged as skills. Observability work has many repeatable patterns: check whether latency rose after a deployment, find high-cardinality attributes, inspect error traces for a customer segment, compare an SLO burn rate with recent events, or look for instrumentation gaps. Giving those patterns to an agent can speed up diagnosis, but it also makes skill execution and result verification part of the reliability surface.
The fourth piece is MCP. Honeycomb's MCP documentation describes agent-oriented access to observability data and metadata, including traces, metrics, logs, BubbleUp investigations, triggers, SLO state, single traces, and raw data rows. That means agent observability is not only a tool for watching agents. It is also a route through which agents use the observability system. Once agents can read operational data directly, their own actions in that system need to be traceable.
| Observation target | Traditional service observability | Agent observability |
|---|---|---|
| Core unit | Request, span, service, deployment | Agent invocation, workflow, tool execution, conversation |
| Failure question | Which service was slow or failing? | Why did the agent choose this tool, context, and evidence? |
| Standardization signal | OpenTelemetry traces, metrics, and logs | OpenTelemetry GenAI agent spans and MCP conventions |
| Sensitive data | User IDs, request attributes, log bodies | Prompts, system instructions, tool arguments, output messages |
Why OpenTelemetry matters here
OpenTelemetry appears repeatedly in this story because vendor-specific agent dashboards will not be enough for production teams. Agents often cross model providers, frameworks, cloud runtimes, and tool servers. Without a telemetry contract, the data splits quickly. One stack may expose prompt events, another may expose model spans, another may expose tool calls, and another may hide the runtime behavior inside a managed console.
OpenTelemetry's GenAI semantic conventions are aimed at this gap. In the 1.41.0 documentation, the GenAI conventions are still marked Development, but the scope is already concrete: model spans, agent spans, workflow spans, tool execution, GenAI events, exceptions, metrics, MCP, Anthropic, AWS Bedrock, OpenAI, and other provider-specific areas. The agent spans documentation defines operation names such as create_agent, invoke_agent, invoke_workflow, and execute_tool. It also describes attributes including gen_ai.agent.name, gen_ai.conversation.id, gen_ai.tool.definitions, gen_ai.input.messages, gen_ai.output.messages, and gen_ai.system_instructions.
The caution is just as important as the promise. The documentation tells existing GenAI instrumentation based on 1.36.0 or older conventions not to change the default emitted convention automatically, and points to opt-in behavior such as OTEL_SEMCONV_STABILITY_OPT_IN=gen_ai_latest_experimental. That is a signal that the standard is still moving. A team adopting agent observability today should not stop at the phrase "OpenTelemetry-based." It should check which semantic-convention version is used, whether attribute names may change, and how those spans line up with existing service traces.
Honeycomb's position is interesting because the company has long emphasized high-cardinality event and trace exploration. Agent execution produces exactly that kind of data. Agent name, conversation ID, tool name, model, provider, retry count, customer segment, workflow ID, prompt-template version, and policy decision can all become useful analysis dimensions. Systems built mainly around low-cardinality metrics may feel strained as agent operations become more granular.
Bedrock AgentCore and MCP expose the operating path
Honeycomb also mentions a production integration with Amazon Bedrock AgentCore in its Innovation Week material. The description points to OpenTelemetry-based agent telemetry flowing into Agent Timeline. This is more than a partner logo. Managed agent runtimes want to absorb more of the execution layer, while observability platforms want the resulting behavior as standard trace data in production views.
That pattern should feel familiar to infrastructure teams. Kubernetes and serverless abstracted runtime details, and operators still needed to understand what happened beneath the abstraction. Agent runtimes create the same pressure. If a company uses Bedrock AgentCore, Vertex AI Agent Engine, Azure AI Foundry Agent Service, OpenAI or Anthropic agent platforms, and internal LangGraph or LlamaIndex runtimes, a single platform console will rarely explain the whole path.
MCP touches the same problem from another direction. Honeycomb MCP gives agents a way to query observability data directly. That is powerful and risky. An agent that can retrieve traces, inspect raw rows, check SLOs, and propose instrumentation changes can speed up incident response. But a bad query, excessive access to sensitive log bodies, or an unsupported conclusion can also create confusion. The moment an agent uses operational data, that agent's behavior becomes part of the operational record.
This feedback loop is the core of the announcement. Agents observe systems. The observability system observes agents. Operators need to connect both timelines. It is no longer enough to know which service slowed down. Teams also need to know how the agent interpreted that slowdown, which evidence it used, and whether its conclusion deserves trust.
The new checklist for development teams
The first design question is the trace boundary. Is one user request one agent invocation? Should several sub-agents or workflow steps live inside one trace? Should each tool execution become a child span? If that model is vague, the timeline may look rich while still being weak for root-cause analysis.
The second question is how much prompt and message content to store. OpenTelemetry's GenAI conventions cover fields such as gen_ai.input.messages, gen_ai.output.messages, gen_ai.system_instructions, and gen_ai.tool.definitions, but these are sensitive by nature. They can include personal data, business secrets, security policies, customer records, or internal identifiers. Observability does not mean storing everything forever. Redaction, sampling, retention windows, and access control need to be designed with the telemetry model.
The third question is how to connect cost and quality signals to traces. Agent failures do not always show up as errors. An agent may succeed while taking too long, spending too many tokens, repeatedly calling the same tool, or reaching a correct conclusion for the wrong reason. Teams need data such as gen_ai.usage.input_tokens, gen_ai.usage.output_tokens, model, provider, finish reason, and retry pattern connected to workflow context.
The fourth question is how to record human approvals and policy decisions. Many agent systems insert human-in-the-loop review or policy gates before risky actions. If those approvals sit outside the trace, the postmortem is incomplete. Operators need to know who approved, what evidence was visible, what alternatives the agent offered, and why a policy engine blocked or allowed an action.
The market is converging between LLMOps and APM
Honeycomb is not moving alone. LangSmith, Arize Phoenix, Datadog LLM Observability, New Relic AI Monitoring, and other tools already trace LLM applications and agent behavior in different ways. The difference is the starting point. LLMOps tools often begin with prompts, datasets, evaluations, and model behavior. APM and observability companies begin with production traces, incident response, SLOs, and service ownership. As agents touch production systems, those markets overlap.
Honeycomb is trying to claim the production observability side of that overlap. That is a practical message for developers. Agent quality cannot end with offline evaluation. Teams need to inspect how agents behave with real users, real tool latency, real permission rules, and real incidents. Observability products also cannot remain only places where humans write queries and inspect graphs. Operational data is becoming input to agents as well as evidence for humans.
The market is still unsettled. The standards are in Development. Vendors differ in their agent trace views, data models, prompt retention policies, evaluation hooks, and MCP support. A team choosing a tool should therefore look beyond a feature list. Can the data be exported through OpenTelemetry? Can raw traces be retrieved? Can prompts and tool arguments be redacted? Can cost data connect to service traces? Can the system satisfy private-environment or self-hosted requirements? Those questions will matter more than a polished timeline screenshot.
The risks are real
Agent observability is necessary, but it can easily become another sensitive-data warehouse. Prompts may contain customer information. Tool arguments may contain internal IDs or queries. Output messages may preserve model-generated mistakes. Operations teams may want long retention, while security and legal teams may want minimization and deletion paths. The observability design needs to reconcile those incentives early.
There is also a risk of overtrusting the timeline. A trace can show which calls happened, which tools were selected, and which text was emitted. It does not reveal the model's internal decision process. Tools like Agent Timeline are best understood as operational evidence, not a complete replay of intent. If teams treat a reasoning-looking artifact as the true cause, they can fool themselves with a very well-formatted log.
The final risk is standard churn. Before OpenTelemetry's GenAI conventions stabilize, instrumentation libraries and vendor implementations may move quickly. MCP, agent spans, workflow spans, and provider-specific attributes are especially likely to evolve with agent platforms. The right response is not to wait for a perfect standard. It is to keep instrumentation behind wrappers and schema mappings instead of scattering event names and attributes throughout application code.
The agent-era postmortem
The strongest reading of Honeycomb's announcement is not simply "we can see AI agents better now." It is that agents have become actors capable of creating production incidents, so they need execution records that can support a postmortem. As models improve and agents take on more work, "the model did it" becomes a weaker explanation, not a stronger one.
Development teams now have to track two forms of reliability. System reliability asks whether services respond correctly, meet SLOs, and survive deployments. Agent reliability asks whether the agent selected the right tool, gathered enough evidence, stayed within cost and time limits, obeyed policy, and left a trail that investigators can inspect after failure. If those two views remain separate, incidents will become harder to explain.
Honeycomb's bet is that these two reliability layers should meet inside observability. Agent Timeline is the interface. OpenTelemetry GenAI conventions are a candidate data contract. MCP is a path for agents to use operational data. Bedrock AgentCore integration is an example of managed agent runtimes meeting production telemetry.
The winner is not decided. The direction, however, is clear. The next bottleneck in agent development is becoming less about whether a model can produce an answer and more about whether an operations team can explain why the agent behaved the way it did. Honeycomb's launch is interesting because it treats AI agent reliability as a postmortem problem, not a demo problem. In production, trust is no longer just a model capability. It is a timeline you can investigate.