DevTools 1.0 gives coding agents eyes on the browser runtime
Chrome DevTools for agents 1.0 moves coding-agent competition from code generation toward browser runtime validation, debugging, and safety.

- What happened: Google released Chrome DevTools for agents 1.0 as a stable package for coding agents.
- It combines an MCP server, a CLI, and agent skills so agents can inspect and debug the live Chrome runtime.
- Why it matters: Coding-agent competition is moving from
code generationtoward validation loops that include console logs, network requests, Lighthouse, accessibility, and memory. - Watch: Handing over an authenticated browser session is useful, but it also expands the blast radius for prompt injection and credential exposure.
- Google’s documentation warns that an agent connected to an active session can act on behalf of the user.
Google's Chrome DevTools team released Chrome DevTools for agents 1.0 on May 19, 2026. At the surface, this looks like a stable MCP server and CLI for coding agents. The deeper shift is more important. Coding agents are no longer being judged only by whether they can write a plausible patch. They are being pushed toward the browser runtime: seeing the page, reading logs, recording performance traces, checking accessibility, and running Lighthouse before they claim the work is done.
Google frames the problem as a gap between code generation and code execution. AI coding tools have become strong at producing web apps, but those apps still have to run in real browsers. A generated React component may type-check and still break on a small screen. A dashboard may render in a mock environment and still fail with a real authenticated network request. A page can look correct while its accessibility tree, Core Web Vitals, or memory profile tells a different story. DevTools for agents tries to pull that last-mile verification into the agent workflow.
That is why this announcement matters beyond Chrome tooling. In 2025 and early 2026, much of the coding-agent race was framed as "which model writes better code?" The question is now shifting toward "which agent can verify its own changes more reliably?" An agent that only sees local files can create components and edit tests. It cannot reliably know whether a mobile menu is covered by the viewport, whether an authenticated admin screen is empty, where a network waterfall slows down, or whether a single-page app navigation is being missed by performance measurement. For that, the agent needs the browser.
Three interfaces in one package
Chrome DevTools for agents 1.0 is less a single tool than a bundle of three surfaces. The first is an MCP server that connects MCP-capable coding agents to Chrome and DevTools features. The second is Chrome DevTools CLI, which Google describes as a more token-efficient option for browser automation tasks. The third is a set of agentic skills that guide agents through specific workflows such as performance debugging and accessibility checks.
The supported client list is broad. Google's documentation mentions tools such as Antigravity, Gemini CLI, Claude Code, Cursor, and Copilot. The GitHub README for the project includes setup examples for Amp, Antigravity, Claude Code, Cline, Codex, Command Code, Copilot, VS Code, Cursor, Factory CLI, Gemini CLI, JetBrains AI Assistant, Junie, Kiro, and others. As checked on May 23, 2026, the repository showed 40.9k stars, 2.6k forks, and 880 commits. That is a useful signal that developers already want to wire browser runtime data into agent workflows.
| Surface | Role | Practical meaning |
|---|---|---|
| MCP Server | Connects LLM clients with Chrome DevTools | Exposes console, network, DOM, and performance data as agent tools |
| CLI | Runs browser tasks through shell-friendly commands | Useful for batch jobs and automation when MCP context gets expensive |
| Agent Skills | Guides agents through performance, accessibility, and troubleshooting flows | Turns raw tools into more repeatable debugging loops |
The interesting part is that Google is not pushing MCP alone. MCP has spread quickly through the agent ecosystem, but it also raises constant questions about token cost and tool-surface size. DevTools for agents 1.0 puts the CLI next to the MCP server. Hacker News comments around Chrome DevTools MCP repeatedly raised the same tension: MCP can consume a lot of context, while a focused CLI command can be cheaper and easier to summarize. Google's stable release appears to acknowledge that agents need both structured tool access and lower-context automation paths.
Code generation ends in the browser
In web development, "the code is correct" is an incomplete claim. Types can pass while the layout breaks. Unit tests can pass against mocked network calls while the real authentication flow fails. A diff can look reasonable without proving that the accessibility tree, Lighthouse result, or memory profile improved. DevTools for agents 1.0 targets this gap by bringing browser inspection into the agent's loop.
Google's published scope is wide. Agents can run Lighthouse audits for accessibility, SEO, best practices, and agentic browsing issues. They can emulate devices and location, throttle CPU and network, and inspect whether a mobile menu behaves under real viewport constraints. For Chrome Extension work, agents can install and reload extensions, trigger actions, and inspect background scripts or extension pages. These are exactly the areas where a file-only agent tends to guess.
Memory analysis is also part of the package. Google says agents can use heap snapshots to find issues such as detached DOM nodes. That used to be the kind of work a performance specialist would do manually by opening DevTools, collecting traces, and interpreting snapshots. Now the agent can make a code change, gather runtime evidence in the same session, and return to the code with a narrower hypothesis. The agent is not merely suggesting a patch. It is beginning to participate in browser-based QA.
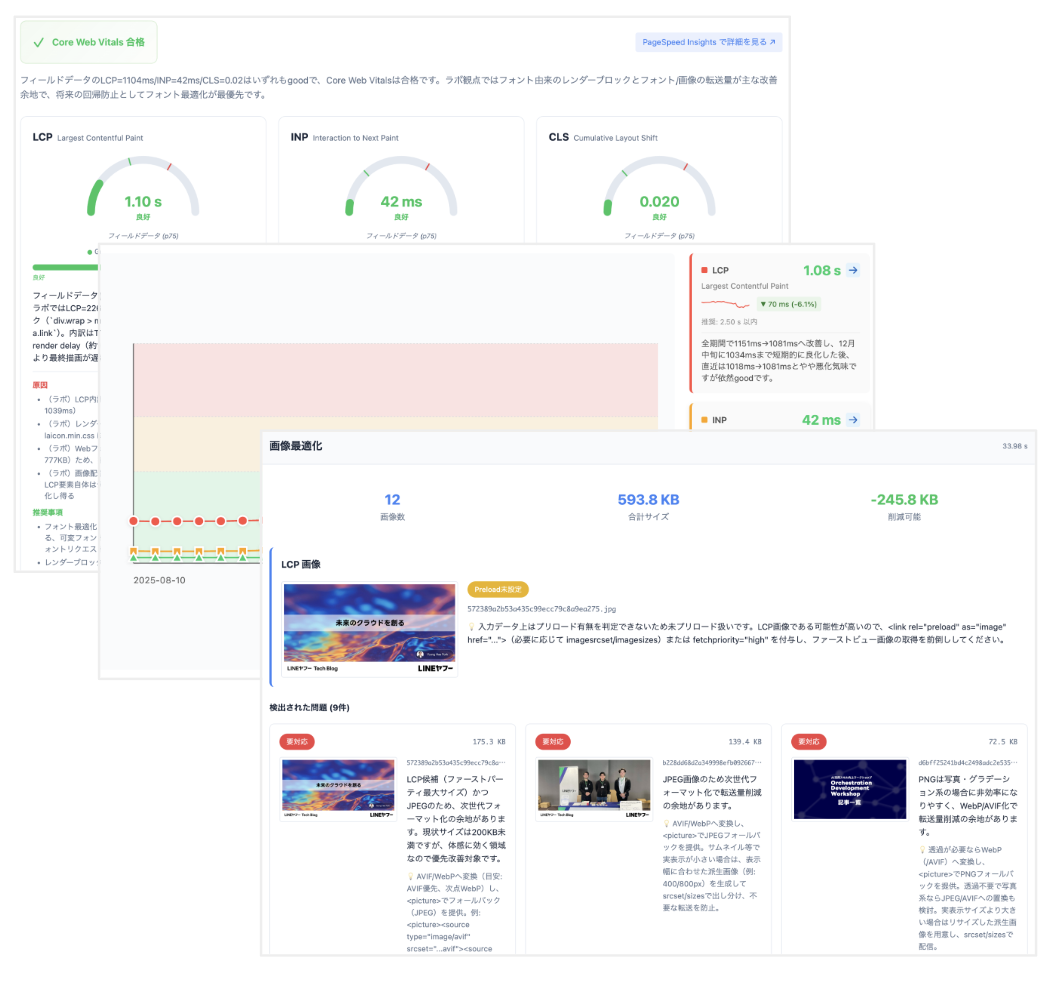
Google's I/O 2026 Chrome roundup gave a concrete example from LY Corporation. Google said LY Corporation built an AI-based performance audit system with DevTools for agents and reduced manual analysis by 96-98%. That figure is more specific than the usual "AI improves productivity" claim. Performance audit work is repetitive but specialized: capture traces, identify bottlenecks, compare Lighthouse and field data, and package findings for a team. If an agent can drive DevTools directly, this work can move closer to pull requests and pre-release gates.
WebMCP and the agentic web
DevTools for agents 1.0 also fits into Chrome's broader I/O story. In the same Chrome roundup, Google introduced WebMCP, a proposal for websites to expose structured tools to browser-based agents. Instead of forcing an agent to click through forms as if it were a person, a site can expose allowed JavaScript functions or HTML forms in a machine-friendly way.
From that angle, DevTools for agents becomes developer tooling for WebMCP. Google's announcement says agents can list WebMCP tools, invoke them programmatically, and validate correctness in real time. Site operators need a way to see what their website exposes to agents. Agents need a way to call structured tools instead of guessing which DOM element to click. DevTools sits between those two needs as the observation and debugging layer.
This is a meaningful shift from older browser automation. Playwright, Puppeteer, and Selenium usually execute scenarios written by humans. In the agentic web framing, the website itself becomes a tool surface for agents. Developers have to think not only about human-visible UI, but also about the structured actions an agent can safely discover and invoke. WebMCP is still an origin-trial-stage proposal rather than a widely proven standard, but bundling it with DevTools for agents makes Google's intent clear: if agents are going to use the web reliably, the web has to become easier for agents to inspect and operate.
The convenience and risk of logged-in sessions
One of the most practical features is auto-connect. By default, DevTools for agents opens a new Chrome instance. Google's documentation also describes --autoConnect, which can connect to an existing Chrome session. For authenticated dashboards, internal admin tools, and screens involving billing, permissions, or organization data, that is powerful. The user does not have to create a fresh test login every time. The agent can pick up the browser state that already exists.
The same feature is also the obvious risk. Google's documentation warns that DevTools for agents exposes browser contents to the agent, and that connecting an active authenticated session can allow the agent to act on the user's behalf. A logged-in browser contains cookies, local storage, page-accessible data, visible personal information, customer data, and whatever the current page can render. What the agent can observe can become input to a model and tool chain.
Hacker News commenters raised this concern directly. An authenticated browser session, prompt injection, and outbound network access can combine into an exfiltration path even without shell access. Imagine an agent inspecting a logged-in admin page that includes malicious user-generated text. If that text tells the agent to send data to an external URL, and the agent also has a network-capable tool, the risk is no longer theoretical. Browser visibility and tool permission become part of the same security boundary.
Teams should therefore treat this as a question of browser isolation, not just convenience. A safe rollout should start with staging accounts, least-privilege sessions, temporary test data, a separate Chrome profile, network egress controls, and tool approval policies. Individual developers should also avoid handing over their everyday browser profile by default. The convenience of session handoff and the risk of session exposure are two sides of the same feature.
MCP versus CLI is a cost debate
The most common community complaint around Chrome DevTools MCP has been token cost. Browser state is large. DOM snapshots, accessibility trees, console logs, network requests, screenshots, trace summaries, and page state can easily overwhelm a model context if passed through naively. In Hacker News threads, some developers said MCP consumed too much context, while others preferred Playwright CLI, smaller Chrome DevTools Protocol wrappers, or site-specific adapters that return compact JSON.
Google's description of the CLI as a token-efficient alternative reads like a response to that concern. Not every browser task needs to be an MCP tool call. Some work is better handled by a command that runs Lighthouse, extracts key failures, writes a trace summary, or filters network requests by status code. The agent can then read the summarized result rather than absorb the whole browser state.
This is ultimately a tool-design problem. DevTools is useful to humans because the whole panel is available when we need it. A model does not need the entire panel dumped into context after every click. A good agent workflow should keep the observation scope small: start with a screenshot or console summary, inspect a specific network request only when needed, collect a performance trace only after a concrete hypothesis, and then verify the fix with narrowly scoped evidence. The success of DevTools for agents will depend less on the number of available tools than on whether agents use them in disciplined sequences.
How this differs from Playwright and other browser agents
There are already many ways to connect agents to browsers. Playwright MCP and Playwright CLI exist. Vercel's agent-browser provides a browser automation layer. BrowserOS puts an MCP server into the browser itself. Developers also build thin Chrome DevTools Protocol wrappers and site-specific adapters. The ecosystem is already crowded because browser runtime access is becoming a basic requirement for agentic development.
Chrome DevTools for agents has a clear advantage in its connection to the official DevTools and Puppeteer ecosystem. Console logs, network analysis, performance traces, heap snapshots, extension debugging, and Lighthouse sit close to the Chrome DevTools team's core work. For performance, accessibility, Chrome Extension debugging, and WebMCP validation, official tooling carries weight. For broader web navigation, scraping, multi-browser orchestration, or long-running remote sessions, Playwright or another browser automation platform may still be more natural.
The product boundary is also different. DevTools for agents is aimed at coding agents debugging web apps. It is well aligned with web QA, performance audits, extension development, and structured tool validation. It is less obviously the default choice for general RPA, arbitrary website automation, crawling, or persistent browser fleets. The tools can overlap, but the intended problem is not identical.
Development teams get a new quality gate
For development teams, the most realistic change is that browser-based agent checks can sit between local implementation and human review. Teams already use Lighthouse CI, Playwright tests, Storybook visual regression, and manual browser checks. Those tools depend heavily on rules and scenarios humans wrote in advance. DevTools for agents adds the possibility that the agent observes a failure and chooses the next investigation step.
Consider a pull request that adds a new dashboard page. An agent could start the local dev server, open Chrome, run Lighthouse, check a mobile viewport, click the menu, read console errors, and inspect failed network requests. If an accessibility issue appears, it can identify the relevant DOM node, update a component, and verify again. This does not make human review obsolete. It reduces the amount of browser busywork reviewers must perform before they can focus on product behavior and architecture.
The standard for coding agents changes accordingly. A good agent is not the one that writes the most code. It is the one that observes quickly, changes narrowly, and verifies with evidence. Browser runtime tools make that standard visible. Instead of saying "fixed," an agent can point to a removed console error, a resolved network failure, a Lighthouse delta, a heap snapshot comparison, or an accessibility-tree improvement.
Operating rules before adoption
Teams should define operating rules before adding DevTools for agents to a shared workflow. First, decide which browser profile an agent may use. A personal default profile should not be the default. Second, decide which sites and environments are allowed. Production admin auto-connect should be the last resort, not the first setup. Third, review telemetry-related options. The GitHub README says usage statistics are enabled by default and can be disabled with --no-usage-statistics. It also says performance tools may send trace URLs to the Google CrUX API, with --no-performance-crux available to disable that behavior.
Fourth, constrain tool approval and network egress. Risk increases when the same agent can both view authenticated browser data and send arbitrary data outward. Fifth, decide how humans will review the agent's findings. A clean Lighthouse result or an absent console error does not prove the product requirement is satisfied. DevTools-based validation is better viewed as a pre-review quality gate than as a replacement for review.
Finally, measure cost. A large MCP tool surface can increase context cost quickly. Teams should mix CLI batches, log files, targeted summaries, and small custom scripts where appropriate. The best workflow does not hand the entire browser to the model on every turn. It narrows the question first, captures only the necessary trace, and records evidence that a human can inspect.
Coding agents now need eyes
The message of Chrome DevTools for agents 1.0 is simple: coding agents need to see the browser. As code generation improves, runtime validation becomes the next bottleneck. Web apps do not end in the filesystem. They live across browsers, networks, authentication, devices, accessibility APIs, performance traces, extensions, and user sessions. DevTools for agents brings that world closer to the agent's working loop.
This does not automatically make autonomous development safe or cheap. Logged-in session handoff is powerful and dangerous. MCP standardizes connection, but it can inflate context. Browser automation tools are plentiful, and some teams may be better served by Playwright CLI, agent-browser, or a focused Chrome DevTools Protocol wrapper. WebMCP is still a developing proposal rather than a settled web standard.
The direction is still clear. A coding agent that wants to be useful in real development cannot stop at writing code. It has to run the app, observe failure, narrow the cause, make a smaller change, and leave evidence. DevTools 1.0 connects that loop to the most familiar web runtime. The race is becoming less about who can generate the longest answer and more about who can find the smallest browser signal and turn it into the right patch.