DevTools 1.0 sets a browser QA baseline for coding agents
Chrome DevTools for agents 1.0 pulls coding agents into real browser QA and debugging loops.
- What happened: Google Chrome shipped
Chrome DevTools for agents1.0 as a stable release.- The package combines an MCP server, CLI, and agentic skills so coding agents can inspect live Chrome through Lighthouse, console, network, and memory tooling.
- Why it matters: The bar for coding agents is moving from code generation toward browser runtime verification.
- Real-world signal: LY Corporation says the workflow cut manual performance-audit analysis by 96-98%.
- Watch: Auto-connect can hand an agent an active browser with cookies, sessions, and authenticated app state.
Google's Chrome team stabilized Chrome DevTools for agents 1.0 on May 19, 2026. At first glance, this looks like one more MCP server reaching a 1.0 milestone. For builders, the more important shift is that coding agents are being pulled out of the narrow loop of editing files and running terminal commands, and into the browser QA loop where applications actually fail. An agent can now open Chrome, inspect the page, read console and network evidence, run Lighthouse, emulate devices and networks, and look for memory leaks inside the runtime it just changed.
The weak point of AI coding tools has been clear. Models can patch React components, rename CSS classes, add tests, and produce plausible diffs. They are much less reliable at knowing whether the result covers a menu on a mobile viewport, breaks a tooltip inside an authenticated dashboard, or collapses under a slow network in a specific region. Google's announcement addresses that gap directly: AI coding tools are good at writing code, but they are often disconnected from its execution.
The 1.0 message is therefore simple: attach the browser to the agent. Browser automation itself is not new. Playwright, Puppeteer, Selenium, Browserbase, browser-use-style stacks, and hosted browser layers already exist. The difference with Chrome DevTools for agents is that it packages the Chrome DevTools observation surface as agent-friendly infrastructure through MCP, a CLI, and skills. The goal is not merely to click buttons. It is to let an agent gather runtime evidence and make a judgment from the same signals a frontend engineer would inspect in DevTools.
DevTools for agents is a three-part package
The official docs describe Chrome DevTools for agents as three pieces. The first is the MCP Server. Through the Model Context Protocol, an AI agent can connect to a real Chrome instance and call DevTools debugging capabilities as tools. The second is the Chrome DevTools CLI. MCP can be token-heavy when every small action moves through tool schemas and structured responses, so the CLI gives teams a way to bundle repeated browser tasks into scripts. The third piece is Agentic Skills: instruction bundles that tell an agent how to approach complex jobs such as accessibility checks, performance debugging, or memory analysis.
The supported surface is intentionally broad. The official setup docs list examples including Antigravity, Gemini CLI, Claude Code, Codex, Copilot, and Cursor. The Codex setup is as small as:
codex mcp add chrome-devtools -- npx chrome-devtools-mcp@latest
The command syntax is less important than the direction of travel. Google is not treating Chrome as a feature bolted onto one IDE or one model. It is exposing Chrome DevTools as a shared runtime observation layer for agents that understand MCP. In a team where Claude Code, Codex, Cursor, and Copilot all coexist, the browser verification layer can converge on the same Chrome DevTools interface even when the editing agents differ.
| Component | What the agent gets | Practical meaning |
|---|---|---|
| MCP Server | Chrome and DevTools features exposed through tool calls | A shared browser observation interface across IDEs and models |
| CLI | Browser workflows bundled into scripts | A lower-token path for repeated QA and performance checks |
| Agentic Skills | Procedures for accessibility, performance, and memory analysis | Operational playbooks become as important as tool wiring |
| Auto-connect | An active Chrome session and tab state handed to the agent | Authenticated debugging gets easier, but delegated browser authority expands |
The 1.0 focus is verification, not automatic clicking
Google's 1.0 announcement puts verification ahead of generic browser control. Agents can run Lighthouse audits for accessibility, SEO, best practices, and performance. They can use DevTools emulation to change viewport size, geolocation, network conditions, and CPU speed, which matters for mobile-only behavior and low-end-device bottlenecks. For Chrome Extension development, they can install and reload an extension, trigger its action, and inspect the background script or extension pages.
The WebMCP connection is also worth watching. WebMCP is an Origin Trial that lets websites expose structured tools to agents. Traditional browser agents infer meaning from the DOM, accessibility tree, and screenshots. With WebMCP, a site can expose tools directly, while Chrome DevTools for agents becomes a development and debugging path for listing, invoking, and verifying those tools. If the web starts treating agents as a first-class audience alongside humans, DevTools also has to expand from a human-facing panel into an agent-facing verification layer.
Memory analysis points in the same direction. The 1.0 announcement mentions tools for heap snapshots and leaks such as detached DOM nodes. That is not the picture of an agent changing CSS and declaring victory. It is the picture of an agent running the app, collecting traces, and acting more like a performance engineer. Frontend teams should pay attention because AI-generated UI code can pass type checks and unit tests while still failing in the browser in ways only runtime evidence can reveal.
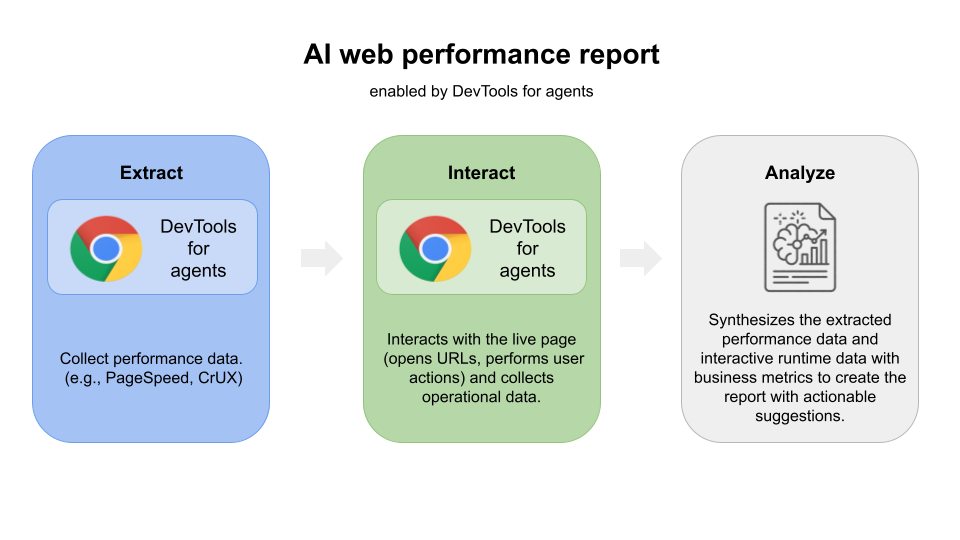
LY Corporation's case study shows that this is not just a demo path. According to Google's April 2026 case article, LY Corporation used Chrome DevTools for agents as a bridge between the browser and its internal performance-audit system. The agent collected DevTools data such as LCP, asset metadata, network request logs, and transfer size. It opened URLs, performed user actions, and reproduced interactions that could affect INP or CLS. Google says the system reduced manual analysis by 96-98% and recovered 8.3 developer-hours per month for the central analysis team.
That figure needs context. LY Corporation is a large internet company with internal tooling and an existing performance-audit process. Installing Chrome DevTools for agents will not automatically give every team the same efficiency. Still, the signal is clear: once an agent can operate inside the browser runtime, a meaningful share of "open DevTools, copy the evidence, and write a report" becomes automatable.
Auto-connect exposes the same face of productivity and risk
The most interesting and risky capability is auto-connect. In the safer default pattern, browser automation runs against a fresh or sandboxed Chrome instance. In real development work, that path often breaks down. Internal dashboards sit behind SSO and VPN. Checkout flows depend on specific cart state. A bug may exist only on the screen a user has already navigated to after several hard-to-repeat steps. Asking an agent to start from a clean browser and log in again is often impractical.
Auto-connect aims directly at that problem by letting an agent inherit the user's active Chrome session. The official docs say the agent can inherit the current tab, browser extensions, and live application state. A developer could log in to an internal staging dashboard, reproduce the problem screen, and then ask an agent to investigate why a tooltip does not appear on Friday's data point. The agent can inspect the accessibility tree, JavaScript APIs, and CSS state, then potentially inject CSS into the current tab to verify a fix.
That convenience is also delegated authority. The auto-connect documentation includes explicit security and privacy warnings. When enabled, an agent can access open tabs, session storage, local storage, cookies, and browser-profile data exposed through JavaScript APIs. The docs also say the server is a local process and does not send browser data, session tokens, or telemetry to Google. That reduces one category of concern, but it does not make the workflow inherently safe. You still have to trust the agent, the MCP client, the model path, the logs, and the prompts you give it.
The GitHub README draws a similar line. chrome-devtools-mcp can expose browser-instance contents to the MCP client, so developers should avoid exposing sensitive or personal information they do not want to share. The README also notes that performance tools may call the CrUX API for real user experience data, and that usage statistics are enabled by default unless disabled with --no-usage-statistics or the corresponding environment variable. What looks like a developer utility is also infrastructure that rearranges browser authority and data flow.
This standardizes the agent observation surface more than it replaces Playwright
It is too narrow to read Chrome DevTools for agents as a simple Playwright replacement. Playwright and Cypress remain strong choices for regression suites, CI, cross-browser testing, and explicit test authoring. Google's new package is aimed at the in-between loop where an agent is working on a task, deciding what evidence to gather, inspecting the browser state, and iterating on a fix with DevTools data in hand.
That distinction matters for AI coding workflows. A human developer can look at a broken layout and infer that a media query, stacking context, or hydration path may be involved. An agent needs more structured observations to make that same leap. DOM structure, accessibility data, network logs, console errors, performance traces, screenshots, and Lighthouse results need to live in the same loop. Without that, an agent can patch the code and still fall back to "it should work" language.
Community reactions cluster around this point. GitHub Discussions raise questions about state restoration, browser compatibility, Docker execution, speed, and token usage. On Reddit and in the broader browser-agent ecosystem, there is a recurring practical sense that agent workflows have moved from scraping, to Playwright-style automation, and now toward real browser runtime layers. The counterpoint is that MCP can be slow or token-expensive. Google's emphasis on the CLI appears to acknowledge that pressure: repeated workflows should be bundled into scripts when tool-call-by-tool-call interaction becomes too expensive or too slow.
Questions development teams should ask now
The first question is about quality gates. If your team's coding agent can open a pull request, how much real browser verification does that PR require? Are type checks and unit tests enough, or should the agent also confirm Lighthouse accessibility output, specific viewport snapshots, console errors, and network failure behavior? Chrome DevTools for agents 1.0 makes it harder to argue that the agent simply could not inspect the browser.
The second question is the permission boundary. Teams need to decide whether agents may use only sandboxed browsers, whether auto-connect is allowed in trusted contexts, and whether company and personal Chrome profiles must stay separate. Anything that can see cookies and local storage belongs in the security policy, not just a developer convenience checklist. If an agent can inspect authenticated pages, the model provider, stored logs, plugins, MCP client, and prompt history all become part of the review surface.
The third question is tool standardization. It is no longer unusual for one team to use Claude Code, Codex, Cursor, and Copilot at the same time. If every tool gets its own browser automation path, reproducibility deteriorates quickly. If Chrome DevTools for agents becomes a stable common layer, teams can separate two questions: which agent changed the code, and which browser evidence proves the change worked.
Chrome's larger position
In the context of the Google I/O 2026 developer keynote, this release points in the same direction as Antigravity, Gemini API managed agents, WebMCP, and AI Studio updates. Google is not only offering models. It is trying to bind the loop in which agents build apps, run them, verify them, and interact with websites that expose agent-facing capabilities. Chrome and Gemini sit at the center of that loop.
That makes Chrome more than a browser. It is the final execution environment for web apps and a sensor through which agents observe software. If agents experience pages like users, inspect internals like DevTools, and score quality like Lighthouse, Chrome's platform position gets stronger. That is convenient for web developers, but it also raises dependence questions. If the standard evidence for agent QA comes from Chrome DevTools, other browsers and runtimes will need comparable observation surfaces.
Not every team needs to drop this into production workflows immediately. But if you already use AI coding agents, one baseline is worth setting now: when an agent says it fixed the code, is that claim backed by evidence from a real browser, or is it only an inference from a static diff? Chrome DevTools for agents 1.0 makes that distinction harder to ignore. In the agent era, "done" should mean more than a code diff. It should include evidence gathered from the execution environment.